Welcome to the Study!
Thank you for your interest in the study. We want to find out if the number of segments in a round bar chart influences the accuracy with which their percentages are perceived.
Depending on how fast you are, the study will take between 10 and 15 minutes.
During the study, you will be asked to read values from round bar charts. Your task is to estimate the percentage shown by the dark blue fill level from the segment with the black outline.
An example of a round bar chart that shows 0% would look like this:
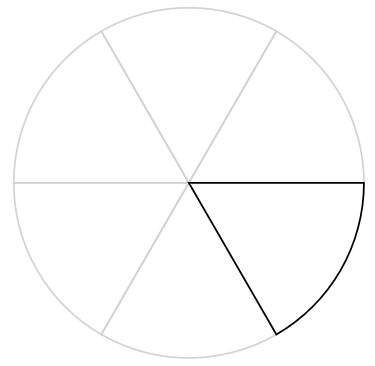
Please note, that in the 0% case, there is no dark blue color visible.
100% would look like this:
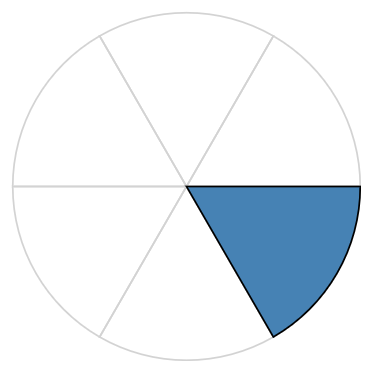
In these two examples, the relevant segment is at the same position. Please be aware, that the position of the segment will change throughout the study. So, always check for the black outline, before making an estimation.
The number of segments will also change.
To submit your judgement, enter the value into the given text field and click the "Submit" button or press "Enter" on your key board.
Please enter integer values and only make a quick visual assessment. Do not try to make precise measurements, either mentally or with a physical object such as a pencil or your finger and work as quickly as possible.
To ensure that the system can show you exactly the same size charts as everyone else, you must first calibrate the system. To do this, take out any banking card, ID card or similar sized card (85.60 mm × 53.98 mm / 3.370 in × 2.125 in) and pull the gray handle on the right-hand side until the rectangular outline fits exactly around the shorter side of your card.
On the next slide, the study starts with the usual study questionaire. Are you ready?
Preliminary questionaire
Please answer the following questions. The answers allow a better comparison of the study results with other studies.
Thanks a lot! Ready? Then click the "Next" button to start the actual study!
Thank you for your participation!
Your results:
Small Break!
The number of segments will change now! Take a short break of half a minute. Relax a bit, then click the button and continue the test.